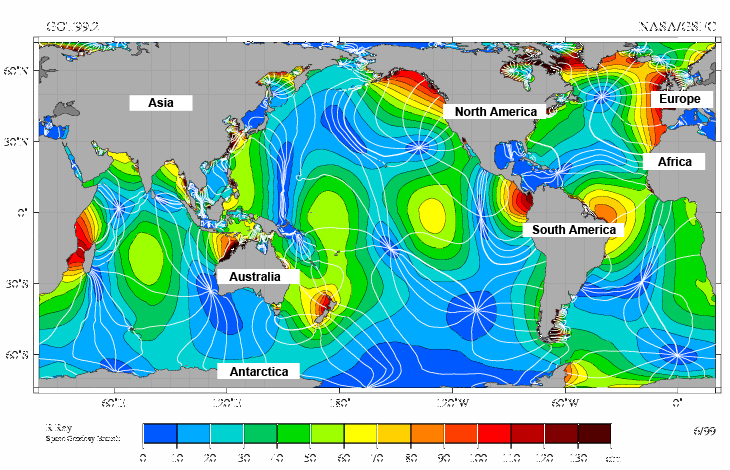
The map above shows the patterns of tidal energy across the surface of the Earth as lines of force. The colors indicate where tides are strongest. The red color displays areas with larger and stronger tidal ranges. Blue colored areas have lower and weaker tidal ranges.
A tidal range is the difference between the high tide and low tide. Look at the animation below. Notice how the water level changes over time. This change difference in the water level is the tidal range. Larger tidal ranges are required to produce more energy for traditional tidal power plants.
Water on our planet moves from place to place. Where there are obstacles such as continents, inlets, and islands, water piles up against these obstructions and flows rapidly past it where it can. This creates tidal currents.
Large tidal currents can be used to turn turbines just like the ones in hydroelectric power plants. Only about 20 locations have good inlets and a large enough tidal range- about 10 feet- to produce energy economically. The largest daily tidal ranges in the world range between 23-38 meters.

