Protocols below are for use with Pasco probes. Click here
for protocols to use the Vernier dissolved oxygen probe.
Materials:
| PasPort Xplorer |
 |
| PasPort dissolved oxygen sensor |
| PasPort dissolved oxygen probe |
| USB cable |
| DataStudio software |
| Temperature and Barometric pressure at your location |
| Deionized water wash bottle |
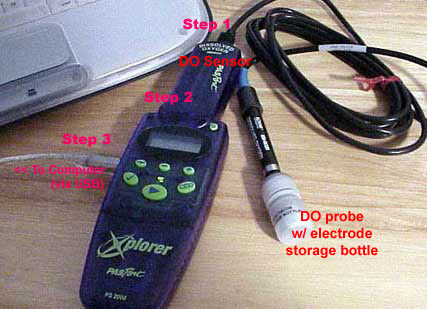
Steps for calibrating the dissolved oxygen sensor:
1. Connect the dissolved oxygen probe to the dissolved oxygen sensor
by screwing it in.
2. Connect the dissolved oxygen sensor to the Pasport Xplorer device.
3. Connect the PasPort Xplorer device to the computer with the USB cable.
4. Open the DataStudio software and select “Launch DataStudio.”
(or "Create an Experiment")
5. Click on the “Setup” button located near the top of the
screen.
6. Make sure the "mg/L" checkbox is checked in the Pasport setup window.
7. Click on the “Calibrate” button in the setup window.
8. Refer to the table 1 & table 2 below and enter the appropriate
concentration (g/mL) of dissolved oxygen value depending on the pressure
(in. Hg) and temperature (°C) at your location. (If this is unknown,
the PasPort temperature and barometer can be
used to take accurate measurements.)
9. Place the dissolved oxygen probe into the deionized water and click
the “Set” button when the dissolved oxygen reading stabilizes.
10. Press the "Ok" button and the sensor should be calibrated.
|
Table 1: Concentration
(mg/L) of Dissolved O2 at Saturation |
| |
29.5
in. Hg |
29.7
in. Hg |
29.9
in. Hg |
30.1
in. Hg |
30.3
in. Hg |
30.5
in. Hg |
30.7
in. Hg |
30.9
in. Hg |
31.1
in. Hg |
31.3
in. Hg |
|
0°C |
14.37 |
14.47 |
14.57 |
14.66 |
14.76 |
14.86 |
14.95 |
15.05 |
15.15 |
15.24 |
|
1°C |
13.98 |
14.08 |
14.17 |
14.27 |
14.36 |
14.45 |
14.55 |
14.64 |
14.73 |
14.83 |
|
2°C |
13.61 |
13.70 |
13.79 |
13.88 |
13.97 |
14.07 |
14.16 |
14.25 |
14.34 |
14.43 |
|
3°C |
13.25 |
13.34 |
13.43 |
13.52 |
13.61 |
13.69 |
13.78 |
13.87 |
13.96 |
14.05 |
|
4°C |
12.90 |
12.99 |
13.08 |
13.16 |
13.25 |
13.34 |
13.42 |
13.51 |
13.60 |
13.68 |
|
5°C |
12.57 |
12.66 |
12.74 |
12.83 |
12.91 |
13.00 |
13.08 |
13.16 |
13.25 |
13.33 |
|
6°C |
12.25 |
12.34 |
12.42 |
12.50 |
12.58 |
12.67 |
12.75 |
12.83 |
12.91 |
13.00 |
|
7°C |
11.95 |
12.03 |
12.11 |
12.19 |
12.27 |
12.35 |
12.43 |
12.51 |
12.59 |
12.67 |
|
8°C |
11.66 |
11.74 |
11.81 |
11.89 |
11.97 |
12.05 |
12.13 |
12.21 |
12.29 |
12.36 |
|
9°C |
11.38 |
11.45 |
11.53 |
11.61 |
11.68 |
11.76 |
11.84 |
11.91 |
11.99 |
12.07 |
|
10°C |
11.11 |
11.18 |
11.26 |
11.33 |
11.41 |
11.48 |
11.56 |
11.63 |
11.71 |
11.78 |
|
11°C |
10.85 |
10.92 |
10.99 |
11.07 |
11.14 |
11.21 |
11.29 |
11.36 |
11.43 |
11.51 |
|
12°C |
10.60 |
10.67 |
10.74 |
10.81 |
10.89 |
10.96 |
11.03 |
11.10 |
11.17 |
11.24 |
|
13°C |
10.36 |
10.43 |
10.50 |
10.57 |
10.64 |
10.71 |
10.78 |
10.85 |
10.92 |
10.99 |
|
14°C |
10.13 |
10.20 |
10.27 |
10.34 |
10.41 |
10.48 |
10.54 |
10.61 |
10.68 |
10.75 |
|
15°C |
9391 |
9.98 |
10.05 |
10.11 |
10.18 |
10.25 |
10.32 |
10.38 |
10.45 |
10.52 |
|
16°C |
9.70 |
9.77 |
9.83 |
9.90 |
9.96 |
10.03 |
10.10 |
10.16 |
10.23 |
10.29 |
|
17°C |
9.50 |
9.56 |
9.63 |
9.69 |
9.76 |
9.82 |
9.89 |
9.95 |
10.01 |
10.08 |
|
18°C |
9.30 |
9.37 |
9.43 |
9.49 |
9.56 |
9.62 |
9.68 |
9.75 |
9.81 |
9.87 |
|
19°C |
9.12 |
9.18 |
9.24 |
9.30 |
9.36 |
9.43 |
9.49 |
9.55 |
9.61 |
9.67 |
|
20°C |
8.93 |
9.00 |
9.06 |
9.12 |
9.18 |
9.24 |
9.30 |
9.36 |
9.42 |
9.48 |
|
21°C |
8.76 |
8.82 |
8.88 |
8.94 |
9.00 |
9.06 |
9.12 |
9.18 |
9.24 |
9.30 |
|
22°C |
8.56 |
8.65 |
8.71 |
8.77 |
8.83 |
8.89 |
8.95 |
9.01 |
9.06 |
9.12 |
|
23°C |
8.43 |
8.49 |
8.55 |
8.61 |
8.66 |
8.72 |
8.78 |
8.84 |
8.90 |
8.95 |
|
24°C |
8.28 |
8.33 |
8.39 |
8.45 |
8.50 |
8.56 |
8.62 |
8.67 |
8.73 |
8.79 |
|
25°C |
8.13 |
8.18 |
8.24 |
8.29 |
8.35 |
8.41 |
8.46 |
8.52 |
8.57 |
8.63 |
|
26°C |
7.98 |
8.04 |
8.09 |
8.15 |
8.20 |
8.26 |
8.31 |
8.37 |
8.42 |
8.48 |
|
27°C |
7.84 |
7.89 |
7.95 |
8.00 |
8.06 |
8.11 |
8.17 |
8.22 |
8.27 |
8.33 |
|
28°C |
7.70 |
7.76 |
7.81 |
7.86 |
7.92 |
7.97 |
8.02 |
8.08 |
8.13 |
8.18 |
|
29°C |
7.57 |
7.63 |
7.68 |
7.73 |
7.78 |
7.84 |
7.89 |
7.94 |
7.99 |
8.05 |
|
30°C |
7.44 |
7.50 |
7.55 |
7.60 |
7.65 |
7.70 |
7.76 |
7.81 |
7.86 |
7.91 |
| |
29.5
in. Hg |
29.7
in. Hg |
29.9
in. Hg |
30.1
in. Hg |
30.3
in. Hg |
30.5
in. Hg |
30.7
in. Hg |
30.9
in. Hg |
31.1
in. Hg |
31.3
in. Hg |
31°C |
7.32 |
7.37 |
7.42 |
7.47 |
7.52 |
7.58 |
7.63 |
7.68 |
7.73 |
7.78 |
| 32°C |
7.20 |
7.25 |
7.30 |
7.35 |
7.40 |
7.45 |
7.50 |
7.55 |
7.60 |
7.65 |
33°C |
7.08 |
7.13 |
7.18 |
7.23 |
7.28 |
7.33 |
7.38 |
7.43 |
7.48 |
7.53 |
34°C |
6.97 |
7.02 |
7.07 |
7.11 |
7.16 |
7.21 |
7.26 |
7.31 |
7.36 |
7.41 |
35°C |
6.86 |
6.90 |
6.95 |
7.00 |
7.05 |
7.10 |
7.15 |
7.19 |
7.24 |
7.29 |
36°C |
6.75 |
6.79 |
6.84 |
8.89 |
8.94 |
8.98 |
7.03 |
7.08 |
7.13 |
7.18 |
37°C |
6.64 |
6.69 |
6.73 |
6.78 |
6.83 |
6.88 |
6.92 |
6.97 |
7.02 |
7.06 |
38°C |
6.53 |
6.58 |
6.63 |
6.67 |
6.72 |
6.77 |
6.81 |
6.86 |
6.91 |
6.95 |
39°C |
6.43 |
6.48 |
6.52 |
6.57 |
6.62 |
6.66 |
6.73 |
6.75 |
6.80 |
6.85 |
40°C |
6.33 |
6.38 |
6.42 |
6.47 |
6.51 |
6.56 |
6.60 |
6.65 |
6.70 |
6.74 |
41°C |
6.23 |
6.28 |
6.32 |
6.37 |
6.41 |
6.46 |
6.50 |
6.55 |
6.59 |
6.64 |
42°C |
6.13 |
6.18 |
6.22 |
6.27 |
6.31 |
6.36 |
6.40 |
6.45 |
6.49 |
6.53 |
43°C |
6.04 |
6.08 |
6.13 |
6.17 |
6.21 |
6.26 |
6.30 |
6.35 |
6.39 |
6.43 |
44°C |
5.94 |
5.99 |
6.03 |
6.07 |
6.12 |
6.16 |
6.20 |
6.25 |
6.29 |
6.33 |
45°C |
5.85 |
5.89 |
5.94 |
5.98 |
6.02 |
6.06 |
6.11 |
6.15 |
6.19 |
6.24 |
46°C |
5.76 |
5.80 |
5.84 |
5.88 |
5.91 |
5.97 |
6.01 |
6.06 |
6.10 |
6.14 |
47°C |
5.67 |
5.80 |
5.84 |
5.88 |
5.93 |
5.97 |
6.01 |
6.06 |
6.10 |
6.14 |
48°C |
5.57 |
5.62 |
5.66 |
5.70 |
5.74 |
5.78 |
5.83 |
5.87 |
5.91 |
5.95 |
49°C |
5.49 |
5.53 |
5.57 |
5.61 |
5.65 |
5.69 |
5.73 |
5.78 |
5.82 |
5.86 |
50°C |
5.40 |
5.44 |
5.48 |
5.52 |
5.56 |
5.60 |
5.64 |
5.68 |
5.72 |
5.77 |
|
Table 2: Approximate Barometric
Pressure at Different Elevations |
|
Elevation
(feet) |
Pressure
(mm Hg) |
Elevation
(feet) |
Pressure
(mm Hg) |
Elevation
(feet) |
Pressure
(mm Hg) |
|
0 |
760 |
2000 |
708 |
4000 |
659 |
|
250 |
753 |
2250 |
702 |
4250 |
653 |
|
500 |
746 |
2500 |
695 |
4500 |
647 |
|
750 |
739 |
2750 |
689 |
4750 |
641 |
|
1000 |
733 |
3000 |
683 |
5000 |
635 |
|
1250 |
727 |
3250 |
677 |
5250 |
629 |
|
1500 |
720 |
3500 |
671 |
5500 |
624 |
|
1750 |
714 |
3750 |
665 |
5750 |
618 |