The following tutorial will help you become familiar
with using a GIS map. Read through the directions below and then go
to the next page to begin using the map.
Once you click on the link to go to the map, a GIS
map will appear. It may take a few seconds for the map to load. The
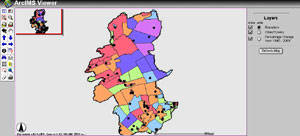
image you will see will be a map of the Lehigh River watershed with
the municipalities that are included in the watershed. It will look
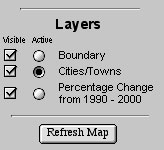
like the image displayed in Figure 1. Note that the upper right corner
of the screen displays the map's layers. See Figure 2 below.
 |
|
|
|
Figure 1.
|
|
Figure 2.
|
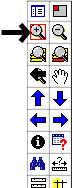
Each municipality is identified with a color and a
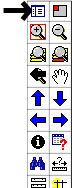
thin black border. Note that the left side of the screen contains a
series of tool icons. This is displayed below in Figure 3. The
black arrow in Figure 3 points to the legend icon. When you click
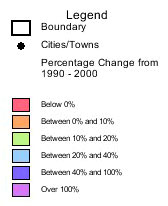
on the legend icon, the map's legend will appear in the upper
right corner of your screen. It will look like the image displayed below
in Figure 4. The colors identify the percentage change intervals for
each county.
 |
|
|
| Figure 3. |
|
Figure 4. |
In order to zoom in on the map and study a specific
area, you need to click on the icon directly below the legend icon,
as shown in Figure 5. You can also zoom out using the icon to
the right of it.
 |
 |
|
| Figure 5. |
Figure 6. |
Figure 7. |
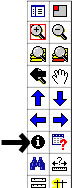
Another helpful feature of a GIS map is the information
icon. See Figure 6. Many GIS maps contain additional information
that you may find useful. For example, if you want to know which city
or town you are looking at on the map, select the Cities/Town layer
by clicking on the circle as shown in Figure 7(be sure to change the
legend back to the layers setting). This makes the Cities/Towns layer
active. Once the layer is active, click on the information icon
and then click on the area that you would like information about. On
this map, the Cities/Towns are indicated by black dots.
 |
| Figure 8. |
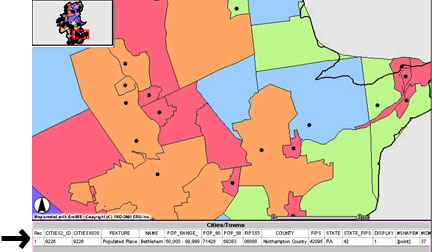
Once you click on a specific city or town, an information
bar will appear below the map, as indicated by the black arrow in Figure
8. Figure 8 shows the map enlarged to a specific area. You can use the
information tool for any layer on the map. Just make sure to
return to the layers box and select the layer that you wish to
use. It is always a good idea to click on "Refresh Map" when
making a new layer active.
Now that you are familiar with using a GIS map, let's
use a map to study population trends in the Lehigh River watershed.