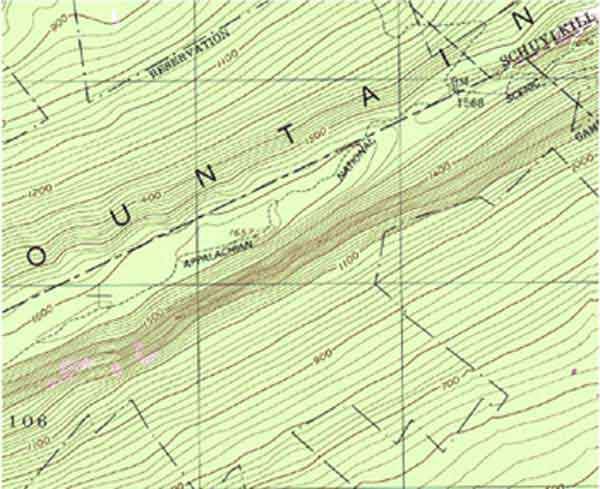
Elevation can be determined using the
contour lines on a topographic map. Contour lines are shown in brown
and they are drawn different widths apart to represent the contour and
elevation of the land. Every point on a single contour line is equal
in elevation. Therefore, contour lines will never cross one another.
Contours that are very close together represent areas that are very
steep. These areas may be mountains or cliffs. Contours that are far
apart represent gradual changes in elevation, such as valleys and plains.
Along each contour line there is usually a number that represents the
elevation, measured in feet, of the area along that contour line.
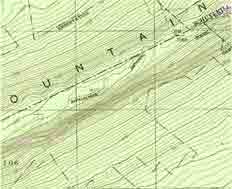
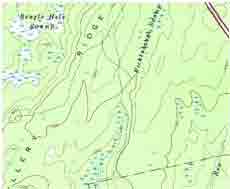
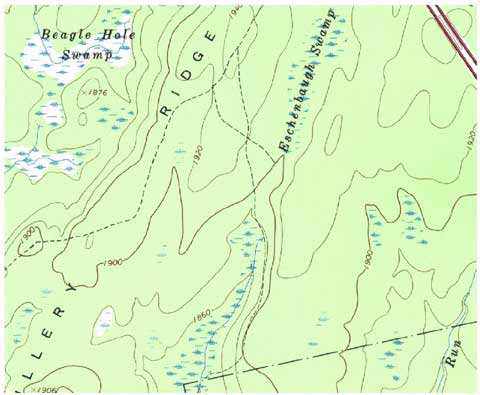
The maps below are examples of how contour
lines are used to represent the shape and elevation of the land. Notice
that the map on the left has contour lines that are drawn close together
in certain areas, indicating steep change in elevation. The contour
lines on the map to the right are much farther apart, showing gradual
change in elevation.